A4E stands for Analytics for Everyone
The News
17/03
2020
COVID-19 In Current Data
10 data visualization dashboards representing vital information are updated 3 times a day
See A4E's graphical dashboard now.
The COVID-19 outbreak is first and foremost a human tragedy, affecting hundreds of thousands of people. The World Health Organization (WHO) labeled the situation as a global pandemic moving so quickly that any piece of information might be outdated in hours.
As experts in data modeling and having a clear vision for the need for accurate, timely and reliable information, we at A4Everyone created graphic data dashboards to track the COVID-19 outburst. We rely on Johns Hopkins University Center for Systems Science and Engineering data compilation, which in turn utilizes streams by WHO, European Centre for Disease Prevention and Control (ECDC), the health departments of China, Singapore, Hong Kong, Canada, Australia, and many more.
We created ten separate dashboards, which are updated 3 times a day and represent the following information:
- Disease development in Bulgaria
- Total cases worldwide since January 20, 2020
- Disease development by country by day
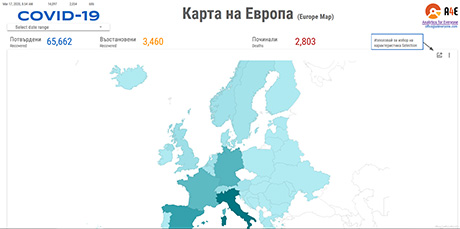
- World map with the distribution of COVID-19
- Map of Europe with the spread of COVID-19
- Mortality rate by day and by country
- Regions and countries in the total number of COVID-19 cases by share
- Detailed daily data in tabular form
- Complete day and country data in tabular form
This effort was inspired by the need to monitor the development of the disease day by day, both in Bulgaria and in other countries. We track numerous metrics such as the number of confirmed cases, new cases for the day, recovered patients, deceased patients, mortality rates, all of which have time series, trackable by region, country, and in total worldwide. In addition to interactive graphics, we also provide the data in tabular form, ready for use by the interested audience.
Interactive maps of Europe and the world easily track countries and regions with severe outbreaks, both in terms of the number of infected persons and the number of fatalities.
Due to the different types and scale of contagion prevention policies implemented, the mortality rate (terminal cases, share of all patients) is one of the most important indicators we monitor overtime - again by country and globally. This percentage may increase over time because most cases are currently incomplete, and we do not yet know what the outcome will be (as recovered or deceased patients). We have to keep in mind that mortality rates are greatly influenced by the range of population testing, which varies from country to country (more patients tested means more detected mild cases that will end with recovery, therefore a lower mortality rate).
At A4Everyone, we are aware that at times like this, we have to protect our employees, partners, and clients. That is why we are already working remotely, and direct meetings are suspended. We continue to serve our customers, supporting them with everything they need to meet the risks and challenges of the fast-changing environment. We recommend that all companies and institutions should implement such policies to reduce the speed of distribution.
"We hope at this hour that everyone will show solidarity and support to both their families and friends and to all other members of society. This moment shows how closely we are connected and that the division of humanity is rather in our consciousness, than it is in the real world.
We pray for all!"
Hristo Hadjitchonev, CEO
We build affordable, advanced, analytical solutions that improve business efficiency.